When working on projects, it’s tempting to tackle only the visible symptoms of a problem. The result is that issues tend to resurface, and teams find themselves in constant fire-fighting mode. That’s when a structured method for identifying root causes becomes invaluable. The Ishikawa Diagram—also called the Fishbone or Cause-and-Effect Diagram—is one of the most effective tools for this job.
Why Use the Ishikawa Diagram
- Clear visualization: It provides a holistic view of the problem by grouping possible causes into categories. This makes it easier for everyone to understand, not just specialists.
- Encourages team discussion: Once the diagram takes shape, it becomes easier for all team members to contribute ideas, even those who are usually quiet.
- Reusable format: Once you create a diagram, you can adapt it for similar problems in future projects.
How to Build an Ishikawa Diagram
- Gather your team
Involve the people who directly face the problem. Explain the issue clearly and invite experts or stakeholders to participate. - Define the main problem (effect)
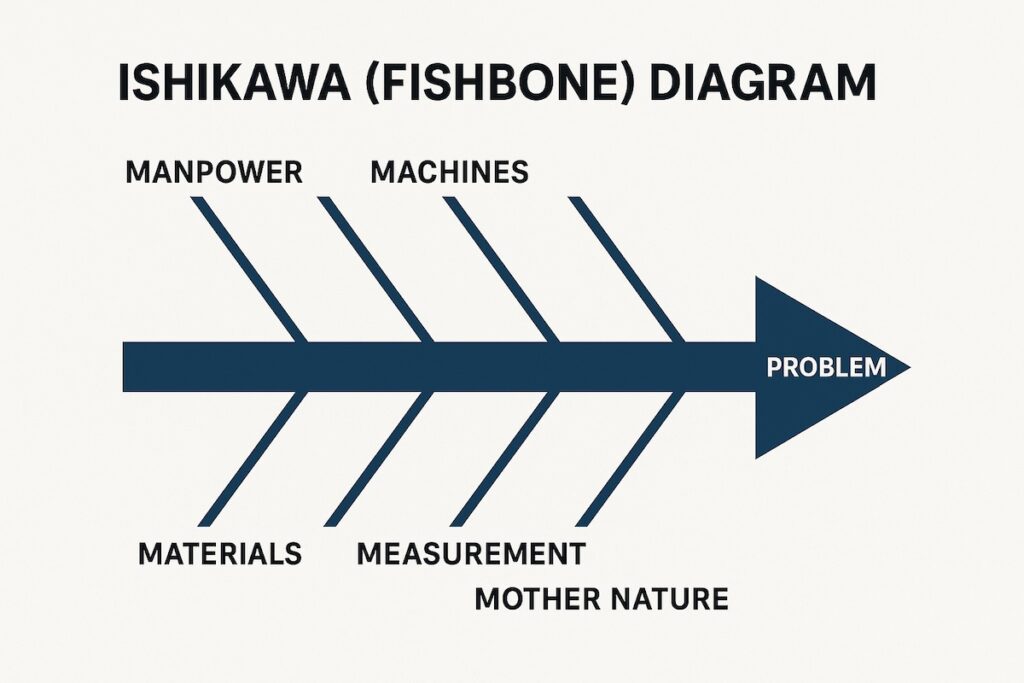
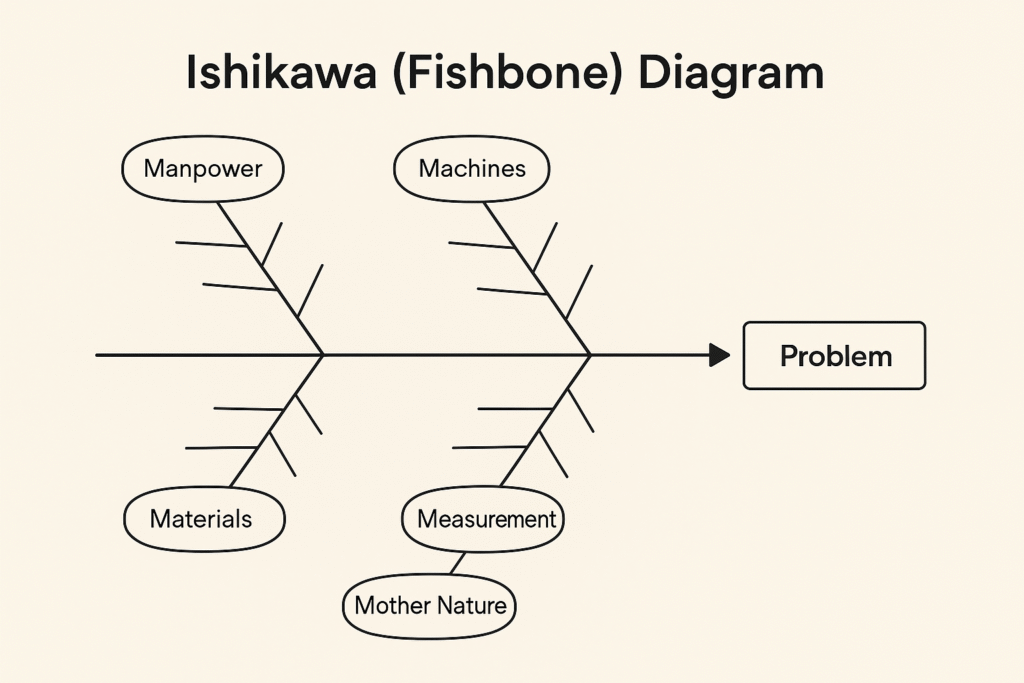
Write a specific statement of the problem—this will be placed at the “head” of the fish. - Identify major categories of causes
The most common framework is the 6 Ms:- Manpower
- Machines (equipment)
- Methods
- Materials
- Measurement
- Mother Nature (environment)
Other variations exist, such as 4–5 S for services or 8 Ps for marketing.
- Brainstorm possible causes
For each category, ask “Why does this happen?” and add each answer as a “bone” branching off the main arrow. Keep drilling down by asking “Why?” again to find deeper causes. - Drill deeper into root causes
Break down each cause into sub-causes until no further useful details emerge. - Analyze and prioritize
Identify the most significant causes. Usually, only a few require focused attention. You can prioritize them based on likelihood and impact.
Benefits at a Glance
- Simplifies complex problems by showing all possible causes in one diagram.
- Improves collaboration by engaging the whole team in problem analysis.
- Helps identify true root causes, not just symptoms.
- Can be applied across industries, from manufacturing to services and product development.